
Energy metering and
power monitoring
Energy data at the level where decisions happen: the machine, the line, the tenant and the chiller. Current and power sensing on our Sensei devices, Modbus meters read through our gateway, and everything reported, alarmed and exported from one platform.

THE PROBLEM
One bill for the whole site tells you nothing about the machine
A utility meter says how much the site used. It does not say which compressor ran all weekend, which line draws power while idle, or which tenant should carry the cost. Without that, energy stays a fixed overhead instead of something a manager can act on.
In hotels the question is different but just as practical. At Taj Hotels we monitored power and run status on chillers and air conditioning units. The data showed downtime as it happened and how fast maintenance responded, which is what the engineering team is measured on.
HOW IT WORKS
Measure at the point of use, report in one place
Current, power and energy sensing
Sensei devices measure current, power and energy directly at a machine or circuit, with variants for temperature and humidity when you want the conditions alongside the load.
Read the meters you already have
Where Modbus meters are installed, our gateway reads them over RS485 or Ethernet and sends the values to the cloud. Integrators set the register map from the cloud application.
Run status, not just kWh
Power draw shows whether equipment is running, idle or off. That turns energy data into downtime, standby waste and runtime figures for maintenance.
Local logic when it matters
Thresholds, alarms and relay outputs run on the device, so a load limit or a fault can trigger an action on site without waiting for the cloud.
Through outages
Sensei stores roughly 10,000 to 40,000 logs in flash and syncs them when the network returns, so a connectivity gap does not become a gap in your billing data.
Reports for audits and billing
Every report carries an audit trail and exports to PDF and Excel. Data can also be queried by AI tools through MCP.
FROM THE FIELD
Where energy data has paid back
Taj Hotels
Power and status monitoring on chillers and AC units gave the engineering team live downtime and a record of maintenance response time.
Machinery energy metering
Energy measured per machine in a production environment, so consumption could be tied to equipment rather than spread across the site bill.
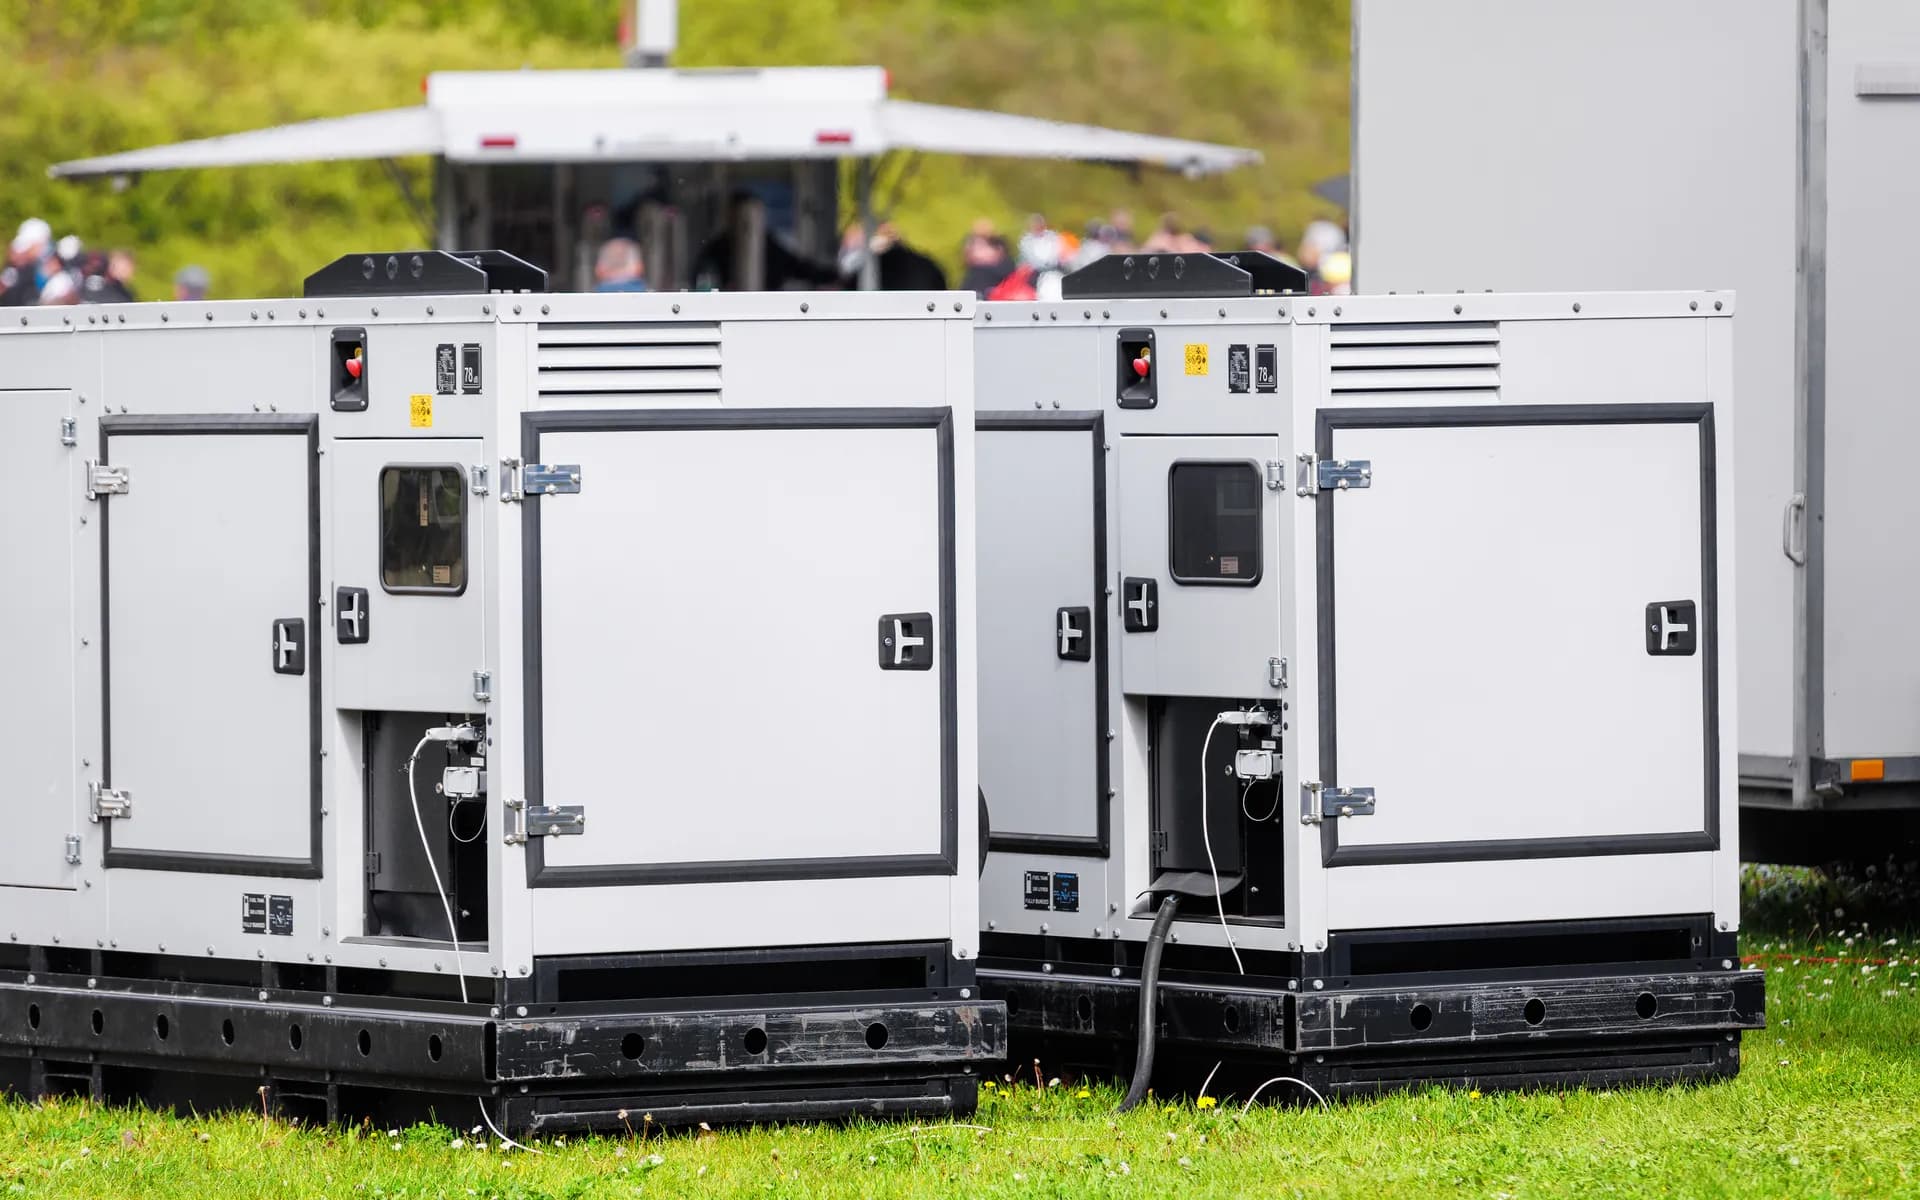
Cold storage and DG sets
Generator status recorded alongside chamber temperature, showing whether backup power held the rooms during mains failures.
APPLICATIONS
Where it is applied
- Factory machine energy monitoring
- Production line energy monitoring
- Commercial tenant sub-metering
- Shopping mall energy monitoring
- Hotel energy monitoring
- Hospital energy monitoring
- School and university campus metering
- Office building energy metering
- Data centre power metering
- HVAC energy monitoring
- Pump and motor power monitoring
- Compressed air system energy monitoring
- Generator electrical monitoring
- Solar PV and AC generation monitoring
- Battery storage AC interface metering
- EV charger energy sub-metering
- Retail chain energy benchmarking
- Industrial energy audit data collection
- Utility distribution feeder monitoring
- Equipment standby power monitoring
FAQ
Questions buyers ask us
Do we need to replace our existing meters?
No. If your meters have Modbus, our gateway reads them as they are. Where there is no meter, a Sensei current or power sensor goes on the circuit you want to measure.
Can we see whether a machine is running or idle?
Yes. Power draw gives run, idle and off states, which is how we reported chiller and AC downtime for Taj Hotels.
Which connectivity is used?
Wi-Fi 2.4 GHz, 4G LTE and BLE as standard, with LoRa or Zigbee added when a site needs them. The gateway also supports Ethernet.
Can the data go into our energy management or BMS software?
Yes. Data can stay in RIOD Live, go to your own server, or be passed to another system through an API.
Want energy data per machine or per tenant?
Tell us what you need to meter, how many points and what meters are already installed. We will propose sensors, gateways and a reporting setup.