

Data Collected Becomes Data Used
Fleets generate enormous volumes of position, event, and sensor data, yet most of it never reaches a decision. Reports are slow to load, locked to fixed templates, or detached from the numbers managers actually act on. A vehicle that sat idle all week, a route that costs more fuel than it should, a driver whose harsh-braking score keeps climbing. The reporting and analytics module surfaces those facts on a schedule, in a format people read, fast enough to be useful even over months of history.
A component of the broader telematics software platform capability, often deployed with Historical Playback and Data Warehouse.
SCOPE OF WORK
What's Included
Scheduled and Ad-Hoc Reports
A report library runs on a schedule or on demand. Daily, weekly, and monthly emails go out automatically, and any user can pull a custom date range and filter set against the same definitions, scoped to the vehicles they are allowed to see.
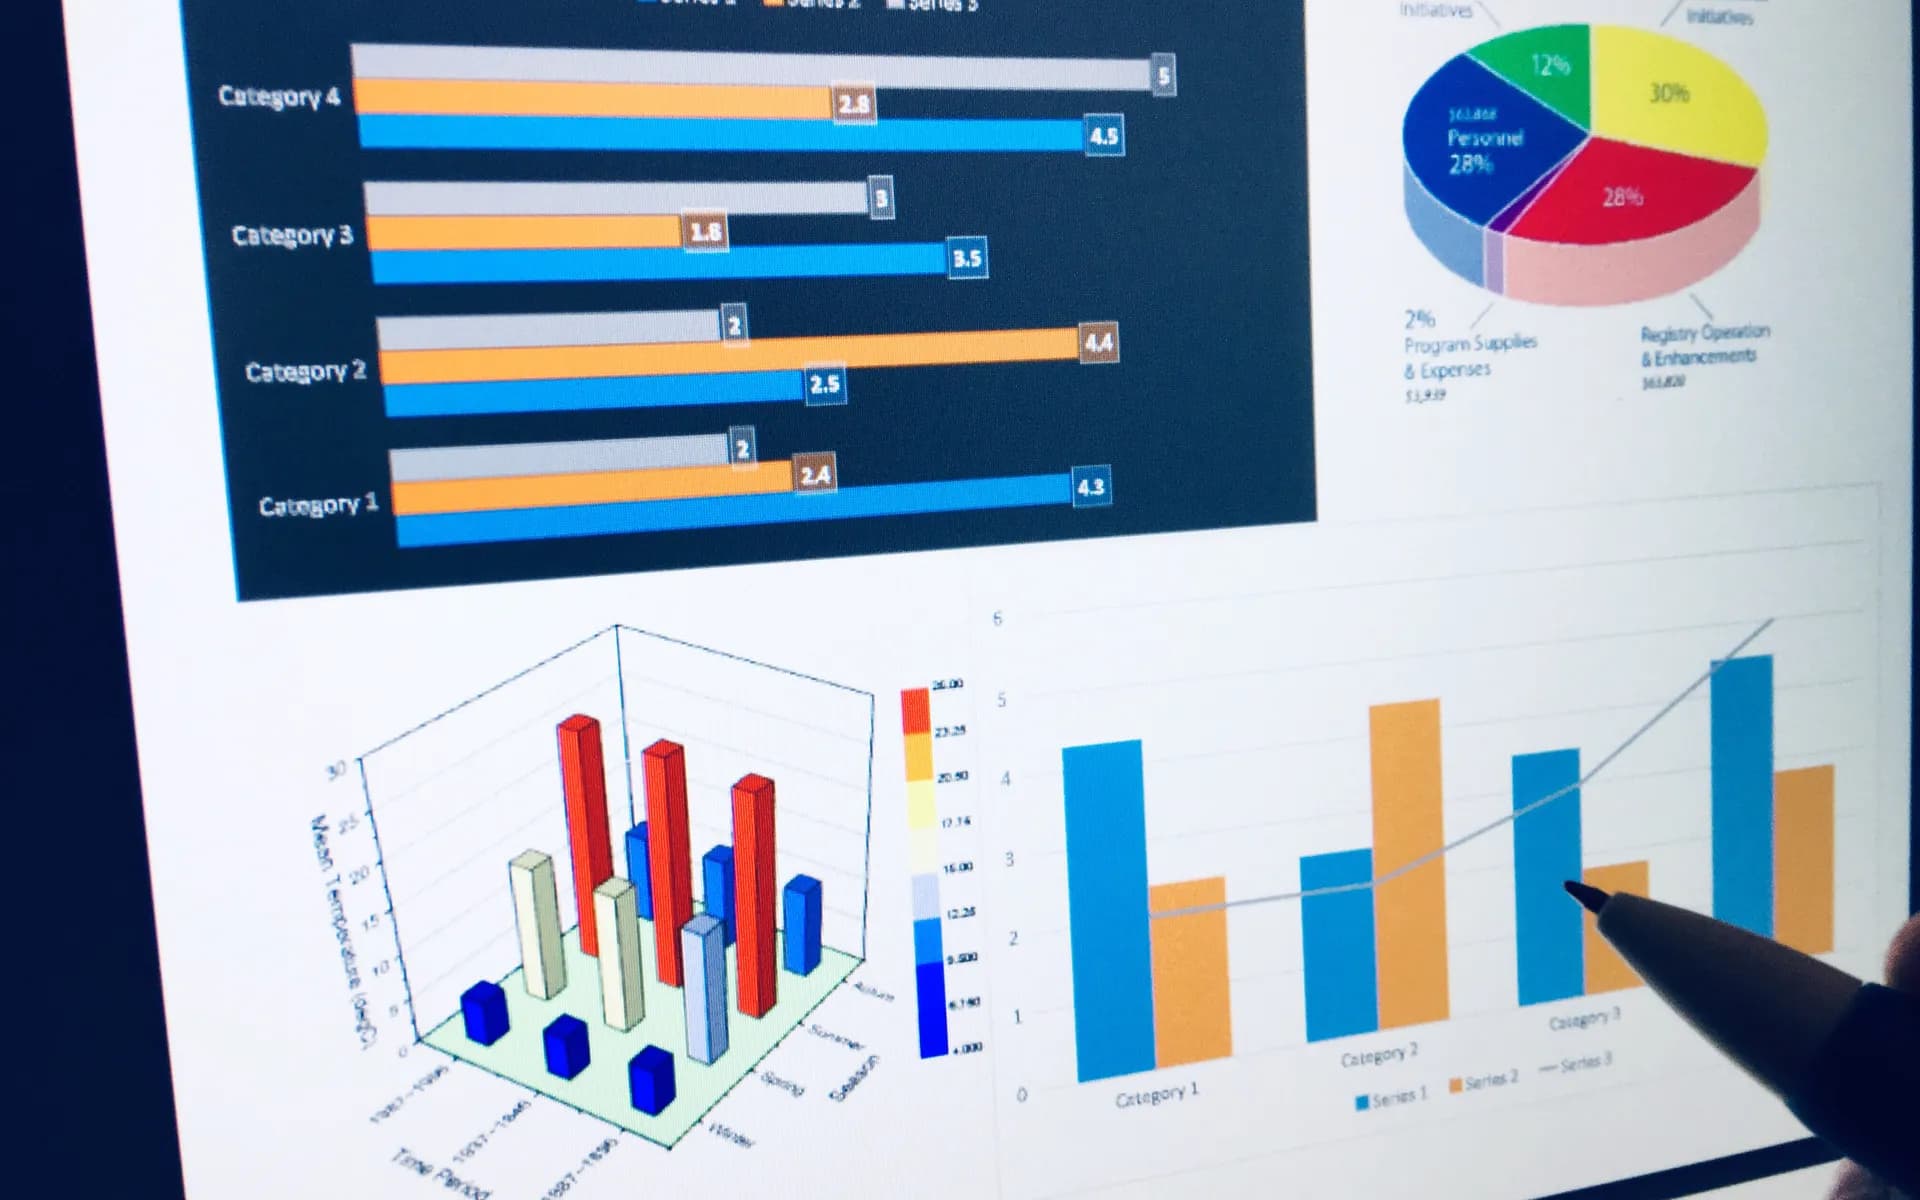
Fleet KPIs
The metrics that drive decisions are computed: utilisation, running hours, idle and stoppage, distance, fuel consumption and theft, overspeed and harsh-event counts, geofence visits, and per-driver scorecards. Each KPI is defined once and reused across reports and dashboards.
Interactive Dashboards
Dashboards offer drill-down from fleet to group to vehicle, time-series charts, heatmaps, and ranked tables. Filters by region, group, and period let a manager move from a summary to the exact trip behind a number in a couple of clicks.
PDF and CSV Export
Every report exports to a branded PDF for sharing and a CSV for further analysis. Exports are generated server-side so a 30-day fleet report renders reliably rather than choking the browser.
Aggregation Pipelines
Pipelines roll raw pings into per-trip and per-day summaries. This is what makes long-range reports fast and what keeps numbers consistent between the dashboard, the scheduled PDF, and any external BI tool.
Embedded BI
Where teams want self-service, Metabase or Superset can be embedded, or a modelled dataset exposed to Power BI or Tableau, so analysts explore the same pre-aggregated data without writing against raw telemetry.
TECHNICAL APPROACH
How It Is Built
Reporting lives or dies on its data model. The hot operational store is kept separate from the analytical one, expensive aggregations are pre-computed, and every KPI is defined in one place so the same number never disagrees with itself across two screens.
Rollup Pipelines
Scheduled jobs and stream consumers roll raw telemetry into trip and daily summaries in a time-series database. Reports read these compact tables, so a month of data for a thousand vehicles returns in seconds where a raw scan would take minutes.
Columnar Analytics Store
For heavy, fleet-wide analytics the aggregates land in a columnar warehouse such as ClickHouse or BigQuery. Wide scans and group-bys that would crawl on a transactional database run comfortably here.
Single Metric Definitions
Each KPI has one canonical definition shared by the dashboard, the scheduled PDF, the CSV export, and any embedded BI. Change a definition once and every surface stays consistent, which is what keeps the numbers trusted.
INTEGRATION AND OUTPUTS
Where the Numbers Flow
Telemetry and Trip Data
The module reads from the same trip and event store the platform builds during ingestion and playback, so utilisation and fuel numbers reconcile with what the live dashboard shows.
Scheduled Email Delivery
The notification engine handles the actual send, so a scheduled PDF report follows the same recipient, time-zone, and entitlement rules as every other communication.
External ERP and Finance
Modelled datasets and CSV feeds are exposed so utilisation and fuel figures flow into billing, finance, and ERP systems without manual re-keying.
Self-Service Exploration
Embedded BI and exposed read models let analysts build their own views on top of the aggregates, without risking the operational database.
FAQ
Common Questions
What reports are included out of the box?
The usual fleet set: vehicle utilisation, distance and running hours, idle and stoppage, trip logs, fuel consumption and theft, overspeed and harsh-event summaries, driver scorecards, geofence visit reports, and maintenance due lists. Reports specific to your operation are added on top, because a cold-chain fleet, a school transport operator, and a logistics company all care about different numbers.
Can reports be scheduled and emailed automatically?
Yes. Any report can run on a schedule, daily, weekly, or monthly, and be emailed as a PDF or CSV to a list of recipients. Schedules respect time zone and only include the vehicles or groups each recipient is entitled to see. Ad-hoc reports run on demand with custom date ranges and filters from the same definitions.
How are reports kept fast over months of data?
Through pre-aggregation. Raw position and event data is rolled up into per-trip and per-day summaries by an aggregation pipeline, so a monthly utilisation report reads from compact summary tables rather than scanning millions of raw pings. For heavier analytics the aggregates land in a columnar store, which keeps even multi-month, fleet-wide queries responsive.
Can dashboards be embedded, or your own BI tool used?
Both. Interactive dashboards sit inside your platform with the KPIs and charts your team needs, and a BI tool such as Metabase or Superset can be embedded for self-service exploration. Where Power BI or Tableau is already in use, a clean modelled dataset or a read replica is exposed so your analysts work against trustworthy, pre-aggregated data.
Turn Your Telematics Data Into Decisions
Share the KPIs your operation runs on and who needs to see them to get a reporting and analytics module that delivers those numbers on schedule, fast, and in a format your team will read.
Schedule a Free Consultation