

Traffic and Junction
Monitoring
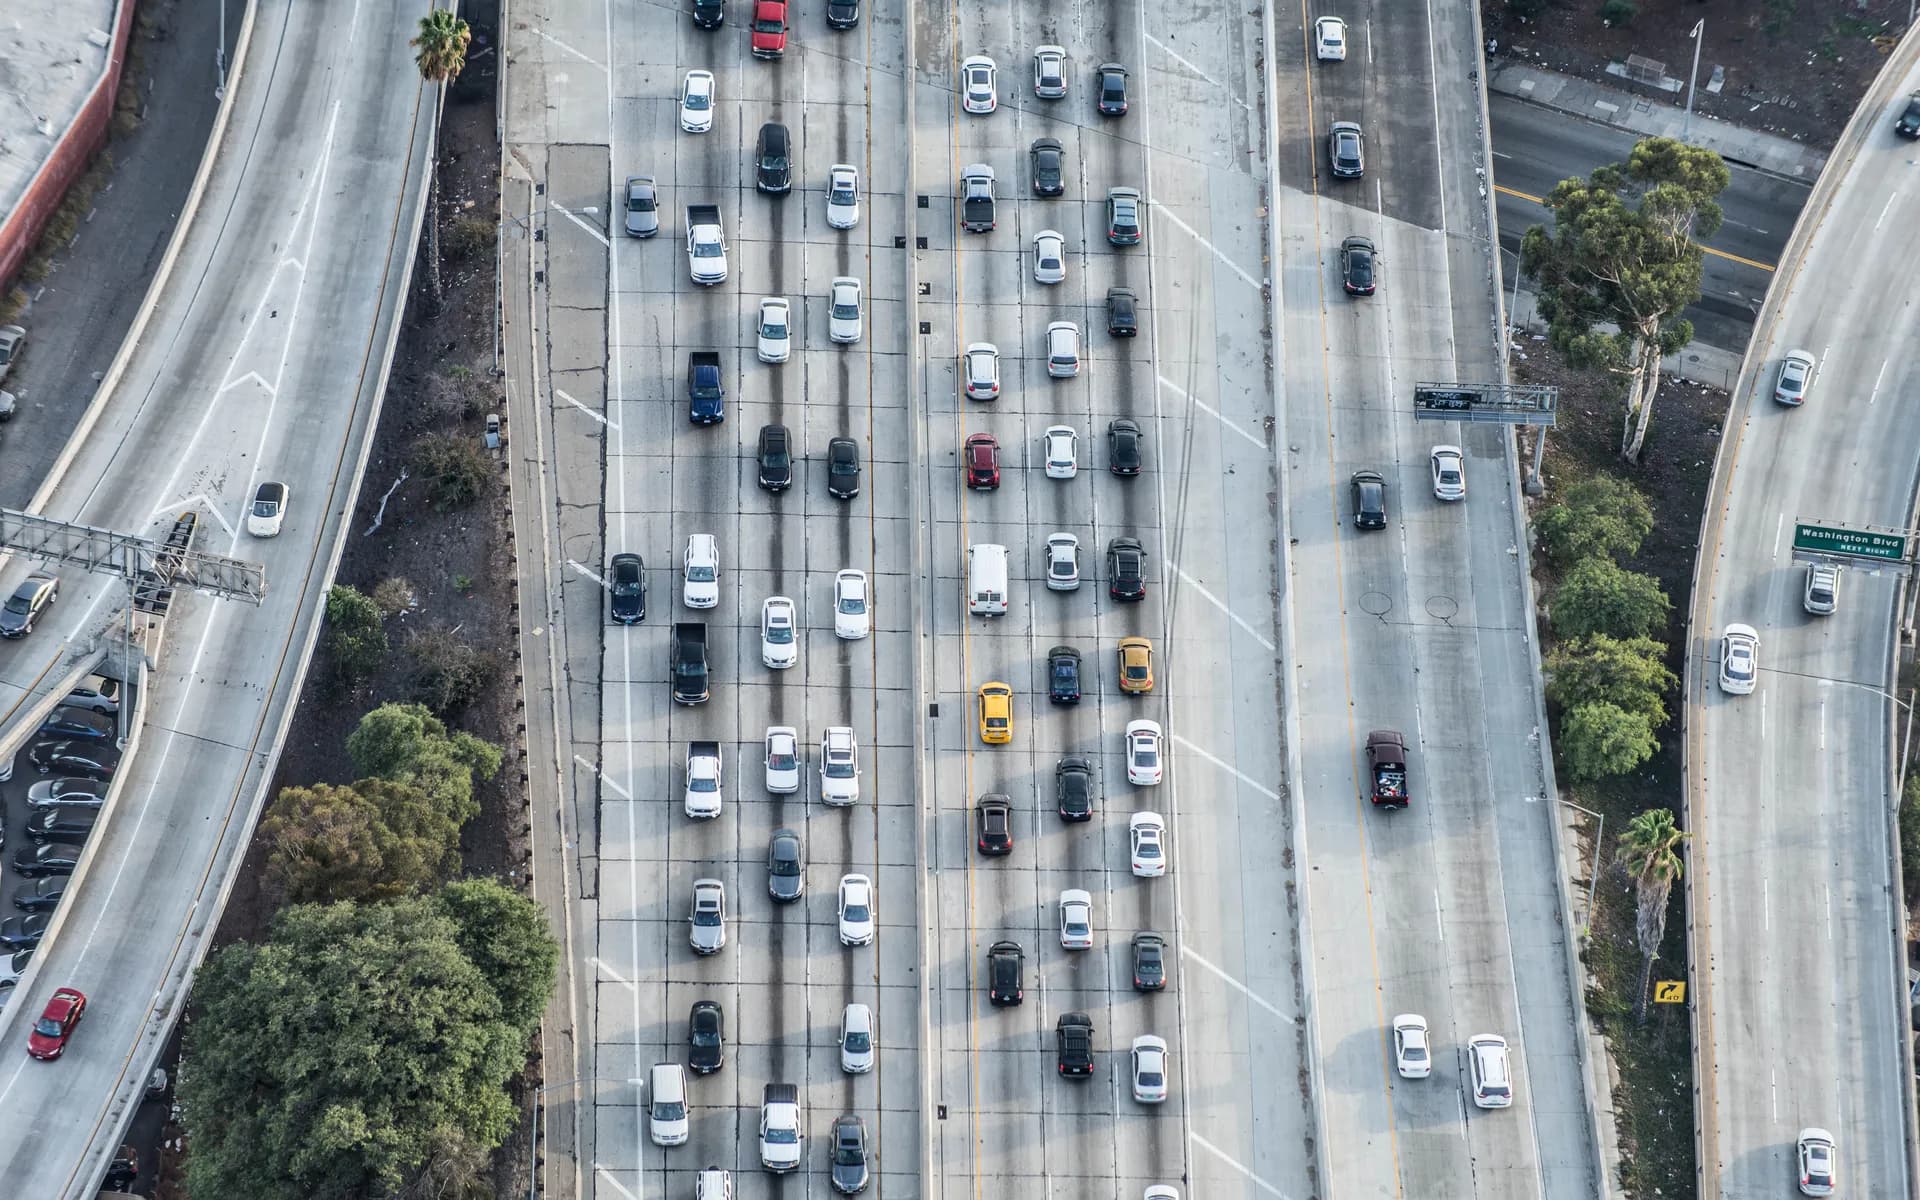
AI traffic monitoring systems that count and classify vehicles, measure junction movements and turning ratios, read plates for context, and feed congestion data into signal optimisation. From the roadside edge box to the traffic control dashboard, the whole stack is covered.
Most Junctions Run Blind on Decades-Old Counts
Signal timing at most junctions is set on a survey done once, by hand, years ago, and never revisited. Operators cannot see live demand on each approach, cannot tell a stalled vehicle from heavy flow, and have no count data to justify a re-time. Manual surveys are expensive, brief, and out of date the week they are filed. Roadside AI nodes replace that, counting and classifying every vehicle, measuring each junction movement continuously, and turning it into a live demand picture the control room and the signal controller can both act on.
Part of the Telematics and GPS Tracking stack, and commonly built alongside Video Telematics and AI Dashcam.
WHAT'S INCLUDED
Roadside AI to Control-Room Dashboard
Roadside Edge Node
A roadside box runs the vision model on the pole instead of streaming raw video back. It pairs a camera with an edge AI module such as an NVIDIA Jetson or a Hailo accelerator, processes frames locally, and sends only counts, classifications, and events over the link. The enclosure is rated IP66 for pole mounting.
Vehicle Count and Classification
Detection is trained and tuned to count vehicles per lane and per approach and to classify them into two-wheelers, cars, LCVs, buses, and trucks. Per-class counts matter for both signal timing and for load and emission planning, and the model is tuned for Indian traffic mix, night, and monsoon conditions.
Junction and Turning Analytics
Each movement through the junction is measured: approach volumes, turning ratios, queue length, and stop-line crossings. That gives operators the movement-level demand they need to re-time a junction, rather than a single aggregate count for the whole intersection.
ANPR Context
Where the use case needs it, plate reading is added for journey-time measurement between cameras, origin-destination sampling, and red-light or wrong-way evidence. ANPR runs as context on top of counting, as part of the same system.
Congestion and Travel-Time Data
The count and ANPR streams become live congestion levels per corridor and section travel times, with historical trends. This is the data layer that feeds public travel information and lets planners see how a corridor actually behaves through the day.
Signal Optimisation Integration
Live per-approach demand feeds into adaptive signal control, integrating with the junction controller so green time follows real demand. Where a city runs an existing ATCS, the demand data is delivered into it rather than replacing the controller.
WHAT YOU EXPERIENCE
From One-Off Surveys to Live Junction Demand
The value of a traffic monitoring system lies beyond the camera. It is that an operator sees demand on every approach in real time, a planner has continuous count data to justify a change, and the signal follows the traffic instead of a fixed plan. Here is how that shows up in the control room.
Live Demand per Approach
Operators see real-time volumes, queue lengths, and turning ratios on each junction arm, so they can spot a building queue or a stalled approach and respond before it spreads across the corridor.
Counts on Tap for Planners
Continuous per-class counts replace the brief manual survey. A re-timing or a new junction design is backed by months of real data rather than a single afternoon of clipboards.
Signals That Follow Traffic
When demand data drives adaptive control, green time shifts to the busy approach automatically. Fixed plans that punish off-peak directions give way to timing that tracks the actual flow.
HOW IT WORKS
From Frame to Signal Plan
Detect at the Edge
The roadside node runs the detection and tracking model on the pole, counting and classifying vehicles and measuring movements per frame. Only structured counts, classes, and events leave the box, so bandwidth and privacy exposure stay low.
Aggregate and Analyse
Counts and ANPR events arrive at the backend over MQTT, land in a time-series store, and are aggregated into per-approach demand, turning ratios, congestion levels, and travel times across the corridor.
Feed Signals and Dashboard
The demand picture drives two outputs: live per-approach demand into the junction controller or ATCS for adaptive timing, and the same data into the control-room dashboard and public travel-time feeds.
STANDARDS AND INTEGRATION
Built to Fit Traffic Control Infrastructure
Edge Compute and Connectivity
Detection runs on Jetson or Hailo class accelerators at the roadside, backhauled over wired fibre where junctions have it or over LTE and 5G where they do not. Running the model on the pole keeps raw video off the network and the data payload small.
Signal and Platform Protocols
Demand data is delivered into junction controllers and adaptive systems, and counts, congestion, and travel times are exposed over REST and MQTT for ATMS, ITS, and SmartCity command platforms. The dashboard can run standalone or feed an existing control centre.
Privacy and Security
Counting and classification need no plate or face, so where ANPR is not required data stays anonymous at the edge. Device links are secured with TLS and per-device credentials, and ANPR records, where used, are access controlled and audit logged for evidentiary use.
FAQ
Common Questions
Do you process video in the cloud or at the roadside?
At the roadside. The vision model runs on an edge accelerator such as a Jetson or Hailo module in the pole box, and only structured counts, classifications, and events leave the node. That keeps bandwidth low, latency tight enough for adaptive control, and raw video off the network for privacy.
What can the system classify, and how accurate is it?
It counts and classifies vehicles into categories such as two-wheelers, cars, LCVs, buses, and trucks, per lane and per approach. The model is tuned for local traffic mix, night, and monsoon conditions, with accuracy validated against manual counts on your sites before sign-off.
Is ANPR required, or can it count without reading plates?
Counting and classification need no plate. ANPR is an optional layer added when the use case needs journey-time measurement, origin-destination sampling, or violation evidence. Where it is not needed, data stays anonymous at the edge.
Can it actually optimise the signals, or only report?
It does both. Live per-approach demand feeds into the junction controller or an adaptive signal system so green time follows real demand. Where you already run an ATCS, the demand data is delivered into it rather than replacing your controller.
Will it integrate with your existing ATMS or command centre?
Yes. Counts, congestion levels, and travel times are exposed over REST and MQTT for ATMS, ITS, and SmartCity platforms, and the dashboard can run standalone or push into your existing control centre.
How many cameras does a junction need?
It depends on the junction geometry and how many approaches and movements you need to measure. A simple intersection may be covered by one or two well-placed cameras, while a large multi-arm junction with turning analysis needs one per approach. This is assessed during the site survey.
Ready to See Your Junctions in Real Time?
Share your corridor details: the junctions, the approaches you need measured, whether ANPR is needed, and the signal system you run today, to get a tailored approach to edge versus cloud and how counts turn into adaptive timing.
Schedule a Free Consultation