

The S3 Hardware Agent: Give Your AI Hands on Real Silicon
Most AI coding assistants are blind to hardware. They can write firmware all day, but they cannot see a register, read a serial line, or watch a logic analyzer trace. The moment your problem lives on the bench instead of in the code, the AI is useless and you are back to manual probing.
The S3 Hardware Agent closes that gap. It is a single tool that connects your physical bench to your AI, and connects your bench to anyone in the world over the internet. Your debug probes, serial ports, logic analyzers, and MQTT channels all live in one view. Your AI reads from them and acts on them through the same agent.
This is how it works.
The problem it solves
Three things slow down hardware debugging more than anything else.
First, the AI cannot see the hardware. You describe a register dump in chat and hope you copied it right.
The AI guesses at the rest.
Second, your tooling is scattered. Serial terminal in one window, logic analyzer software in another, the f lasher in a third, an MQTT client in a fourth. Nothing talks to anything.
Third, remote support is painful. A tester in another city has the board. You have the knowledge. You end up on a screen share saying "try this, now try that" for an hour, with no direct access to the target.
The Hardware Agent removes all three. One pane of glass for the bench. The AI reads and writes through it. And any bench can be shared with an ID so a human or an AI can work it remotely.
Step by step: running the agent
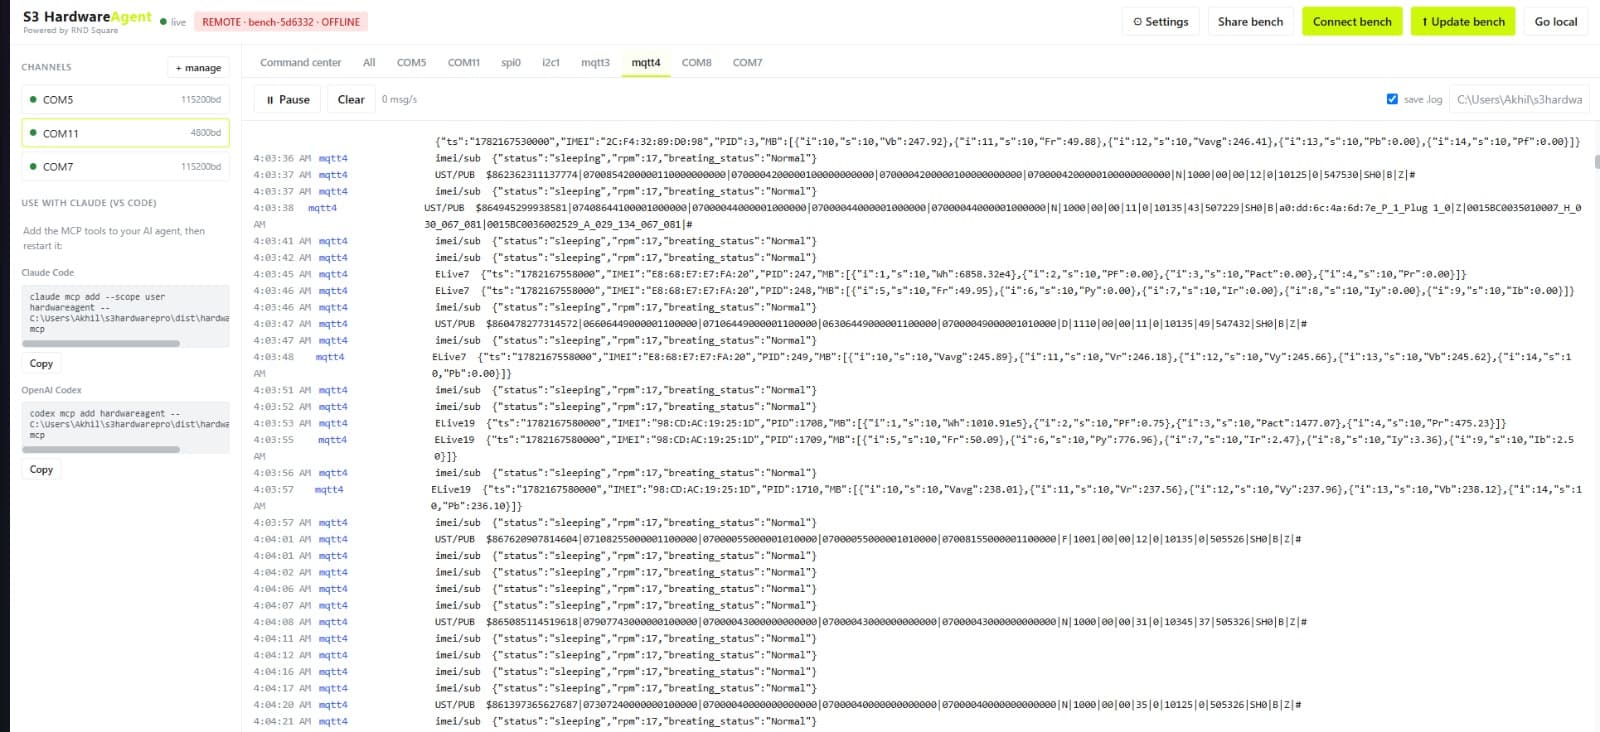
1. Launch it. Double-click the S3 Hardware Agent file to open it. A browser-based UI opens up. This is your bench dashboard.
2. Add your components. In the UI, add everything you want to monitor and control. The components you want to check, your MQTT broker rules and channels, logic analyzer channels, serial ports, SSH connections. Add as much as you need. It all shows up together in one view so you are not jumping between five tools.
3. Connect your probe. Plug your debug probe into the target board on the bench. J-Link, ST-Link, or NuLink all work. The agent picks it up as part of the bench.
4. Wire it to your AI. The UI shows a small MCP code snippet. Copy it and paste it into Claude (desktop or Claude Code). Close Claude, then open it again. Check that the hardware agent shows up as a connected tool. Once it does, the AI can see the bench.
5. Put the AI to work. Now the AI operates through the agent. Ask it to read registers and it routes the request through the probe and pulls them back. Ask it to flash firmware and it loads it onto the target. Ask for logs and it collects them. The AI sees every component you added, and it acts on the real hardware instead of guessing.
That is the full local loop. Components in, probe connected, MCP linked, AI reading and writing live.
Sharing a bench over the internet
This is where the agent earns its place. Say the device under test is sitting with a tester in another location. You do not need the board shipped to you.
1. The remote side runs the agent and adds their components, exactly as above.
2. They share the bench. They click Share Bench, then Internet, then Share. That generates an ID.
3. You connect to it. Copy that ID. Go to Connect Bench under the Developer menu and paste it in.
Now the view you are looking at is the remote machine's bench. The logs inside it, the components added to it, the serial and probe data, all of it is the remote setup rendered on your screen.
And here is the part that matters. Your AI is still talking to your agent, and through that agent it can now work the remote machine. It can program files, read files, run tests, and pull logs on a bench that is physically somewhere else.
So you get two benefits at once:
- A human can see and debug the remote bench directly. No more "try this, try that" over a screen share.
- The AI agent can act on the remote machine too. It flashes, reads, and tests on hardware in another city as if it were on your desk.
What you can pull from the bench
The agent is built to go deep, not just give you a status light.
- Registers and memory through the connected probe. Ask for a register and it reads it off the silicon.
- Firmware flashing straight to the target through the same probe.
- Multiple serial ports at once. Open three or four serial streams in parallel.
- Multiple logic analyzers. Decode the protocol or look at raw readings, whichever you need.
- MQTT channels for the connected and cloud side of the device.
- Component-level reads across everything you added to the bench.
Add what the job needs and the agent gives you the deep view, not a summary.
Where this goes next
The agent does not have to live on your laptop. Drop it onto a Raspberry Pi, hang a USB hub off it, and connect your programmers, logic analyzers, and components to that. Now the Pi is a standalone bench host. You do all your programming and monitoring through it, remotely, with the AI in the loop. A permanent, sharable test station that sits next to the hardware and answers to both your engineers and your AI.
Why it matters
The whole point is to stop treating hardware as something the AI cannot touch. With the S3 Hardware Agent, the bench becomes a first-class input.
Registers, firmware, logs, serial, and analyzer traces are all available to the person debugging and to the AI helping them, whether the board is on the desk or on the other side of the country.
One view for the whole bench. AI with real hands on the hardware. Any setup sharable with an ID.
That is a different way to debug hardware, and it is how the S3 Hardware Agent is built to work.
Part of the S3 ecosystem by RNDSquare. Talk to our engineers about putting it on your bench. rndsquare.com